Import all required libraries
— — — — — — — — — — — — —
import pandas as pd
from sklearn.model_selection import train_test_split
from sklearn.tree import DecisionTreeClassifier
from sklearn import tree
import matplotlib.pyplot as plt
import random
import os
— — — — — — — — — — — — — — — — — — – — ———————-
Define a Data Frame with three attributes named A, B, C, and fourth as decision variables, D.
Here, some random data and random decision classes are created and initialized, and taken over in order to
— — — — — — — — — — — — — — — — — — — — — — — — — — —
In this
DF = pd.DataFrame(columns=[‘A’,’B’,’C’, ‘D’])
— — — — — — — — — — — — — — — — — — — — — — — — — — —
Attribute defining 100 data entry points, taking value from the random choice of 85, 90, 95, 98, 100, 104
— — — — — — — — — — — — — — — — — — — — — — — — — — —
AttrubuteA1 = np.empty(100)
for i in range(0,99):
AttrubuteA1[i] = random.choice([100,90, 95, 98, 85, 104])
— — — — — — — — — — — — — — — — — — — — — — — — — — —
Second & Third Attribute defined in the same way
AttrubuteA2 = np.empty(100)
for i in range(0,99):
AttrubuteA2[i] = ….
AttrubuteA3 = np.empty(100)
for i in range(0,99):
AttrubuteA3[i] =….
— — — — — — — — — — — — — — — — — — — — — — — — — — —
Defining Decision Class with values of two decisions as defined here
decisionClass = np.empty(100)
for i in range(0,99):
decisionClass[i] = random.choice([1, 2])
DF = DF.assign(A=AttrubuteA1)
DF = DF.assign(B=AttrubuteA2)
DF = DF.assign(C=AttrubuteA3)
DF = DF.assign(D=decisionClass)
— — — — — — — — — — — — — — — — — — — — — — — — — — —
Copying the generated data into csv file
— — — — — — — — — — — — — — — -— — — — — — — — — — — — — –
DF.to_csv(“TheFinalDataCSV.csv”)
data = DF
print(data)
data = data.dropna()
X = data[[‘A’, ‘B’, ‘C’ ]]
y = data[[‘D’]]
x_train, x_test, y_train, y_test = train_test_split(X, y, test_size=0.3, random_state=65)
decisionTable = DecisionTreeClassifier(max_depth=2)
decisionTableModel = decisionTable.fit(x_train, y_train)
predictions = decisionTable.predict(x_test)
print(predictions[:50])
from sklearn.metrics import accuracy_score
print(accuracy_score(y_test, predictions))
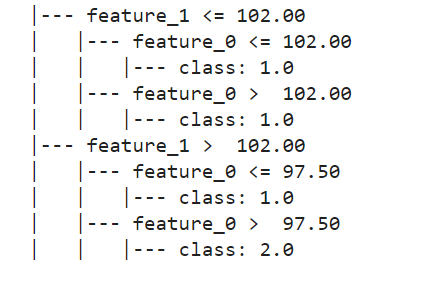
text_representation = tree.export_text(decisionTable)
print(text_representation)
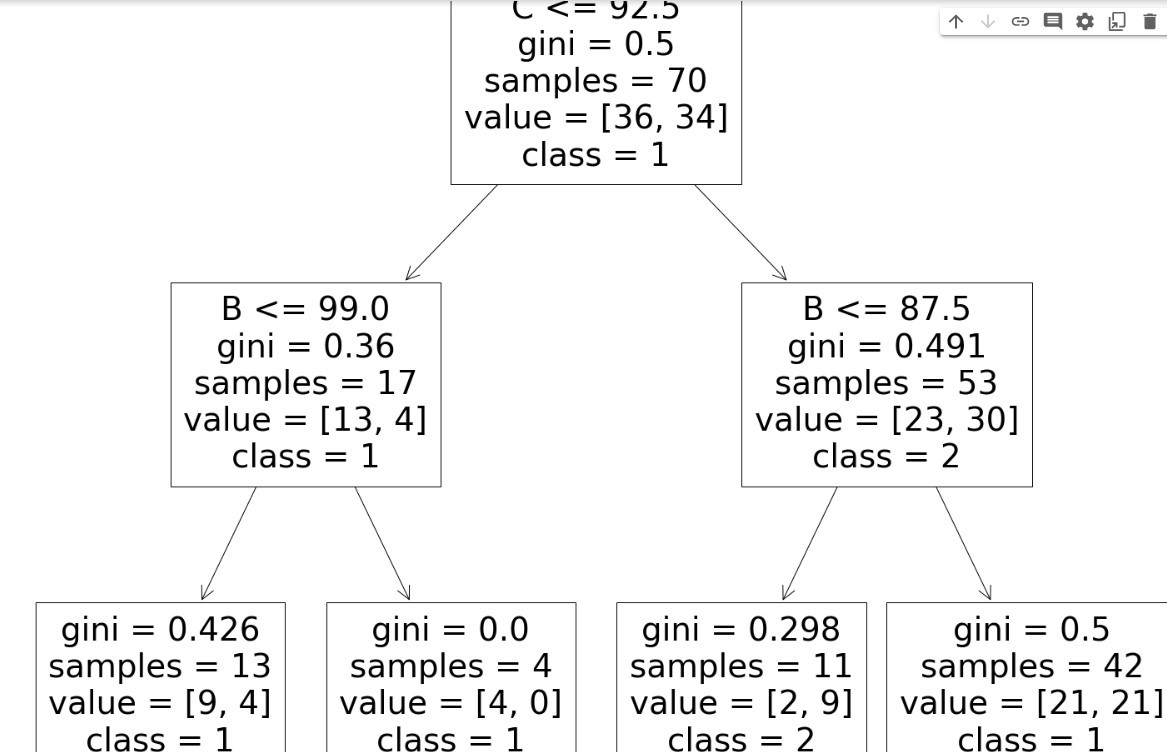
fig = plt.figure(figsize=(25,20))
class_names = [‘1’, ‘2’]
_ = tree.plot_tree(decisionTable, feature_names=X.columns,
class_names=class_names )
Sample Output
Depiction of Sample Rules Generated