Handling missing value in data is crucial. Questions arise how to deal with it, given a empty, Null, or large positive and large negative value are not easy to handle. How to use these values then, how to process the data after that.
Some people deal with missing values by removing the rows or tuples that having missing value in it. Sometimes entire columns are deleted.
Here are some basic steps to use data with missing value. Although filling in missing value, there are many algorithms for it. But we will deal with that later, right now we will detect the missing values and give them a high negative number and fill in the missing values based on mean and median of that column of the data.
It can be understood as follows:
Although there are algorithms which can predict missing value accurately. But here, I explain, simple concept, for any column, meaning a feature in data space.
Take a columns viz. a feature and detect missing value, mean value, median and mode. Fill in missing values with the most comfortable one out of these, I chose mode in many cases while computing in a deep learning model. Here is the code and data with missing value:
The figure shows a snipped of missing data:
Code to read file with missing data
import pandas as pddf = pd.read_excel(‘/content/sample_data.xlsx’)print(df)
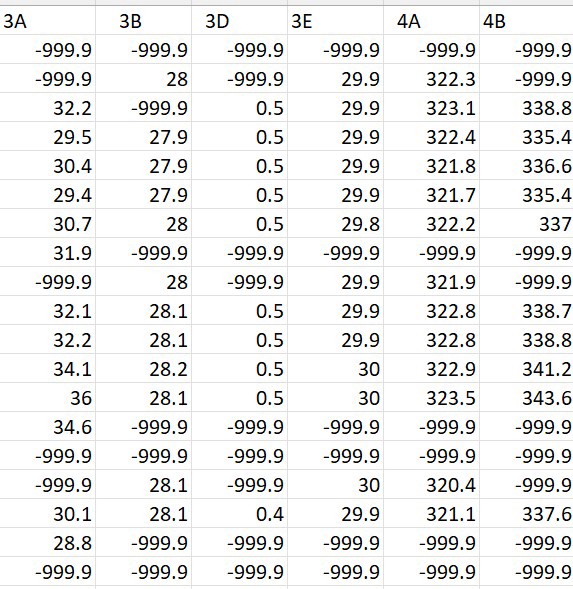
In this data very large negative value is put where the data was missing. More larger negative value could had been used to depict missing value as well. Since we are not using these entries, so -999.9 is sufficient. We are just filling it to be detected with ease by the steps.
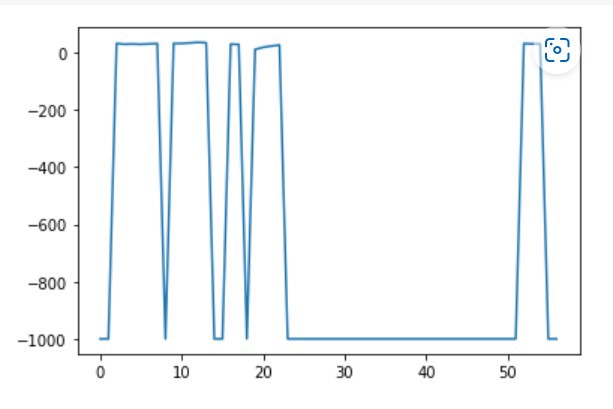
Plotting the data:
df[‘3A’].plot()
This is the output:
Code to find the mean, median and mode from the column, viz. feature 3A here, ( please see indentation on yourself)
df_column = df[‘3A’]
columns = [‘3A’]
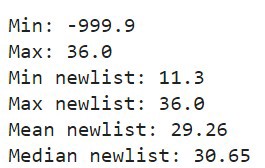
print(“Min:”, np.min(df_column))
print(“Max:”, np.max(df_column))
newlist = []
j = 0
for i in range(len(df_column )):
if df_column[i] != -999.9:
newlist.append((df_column[i]))
j += 1
print(“Min newlist:”, np.min(newlist))
print(“Max newlist:”, np.max(newlist))
print(“Mean newlist:”, np.mean(newlist))
print(“Median newlist:”, np.median(newlist))
mean_val = np.mean(newlist)
Replacing the null values with mean values
newdf = pd.DataFrame (newlist, columns = columns)
edited_data_column = []
j = 0
for i in range(len(df_column )):
if df_column[i] != -999.9:
edited_data_column.append((df_column[i]))
else:
edited_data_column.append(mean_val)
j += 1
df_filter[‘3A’] = pd.DataFrame (edited_data_column, columns = columns)
So the code reads a column 3A form the data, the first column, computes mean, min, max, median and mode of this column. A list is made with missing values represented as large negative numbers replaced by mean of the value. You should try median and mode as well, to check for accuracies of the system.
Here is the output of the system
Later this column is added to the new data frame.
Then we plot it and see the data distribution
df_filter['3A'].plot()
Here is the plot output:
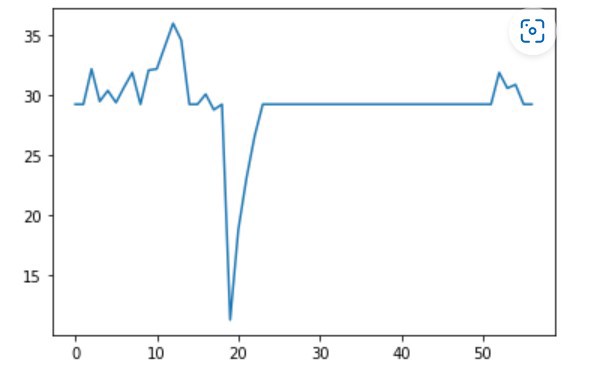
So all null or missing values filled in . Let us find non null values in data:
Percentage of Non-Null Values: 35.7142%
Once again there are lot of techniques to do this I am providing a basic way in which the data can be quickly scanned, so that this data can be used on for quick analysis or for model building. This can be performed for evaluation and then more sophisticated techniques can be used to fill missing data.
Till then, find accuracies on all, the fillers, mean, median, mode and check for results.

One thought on “Handling Missing Values in Data in Python”